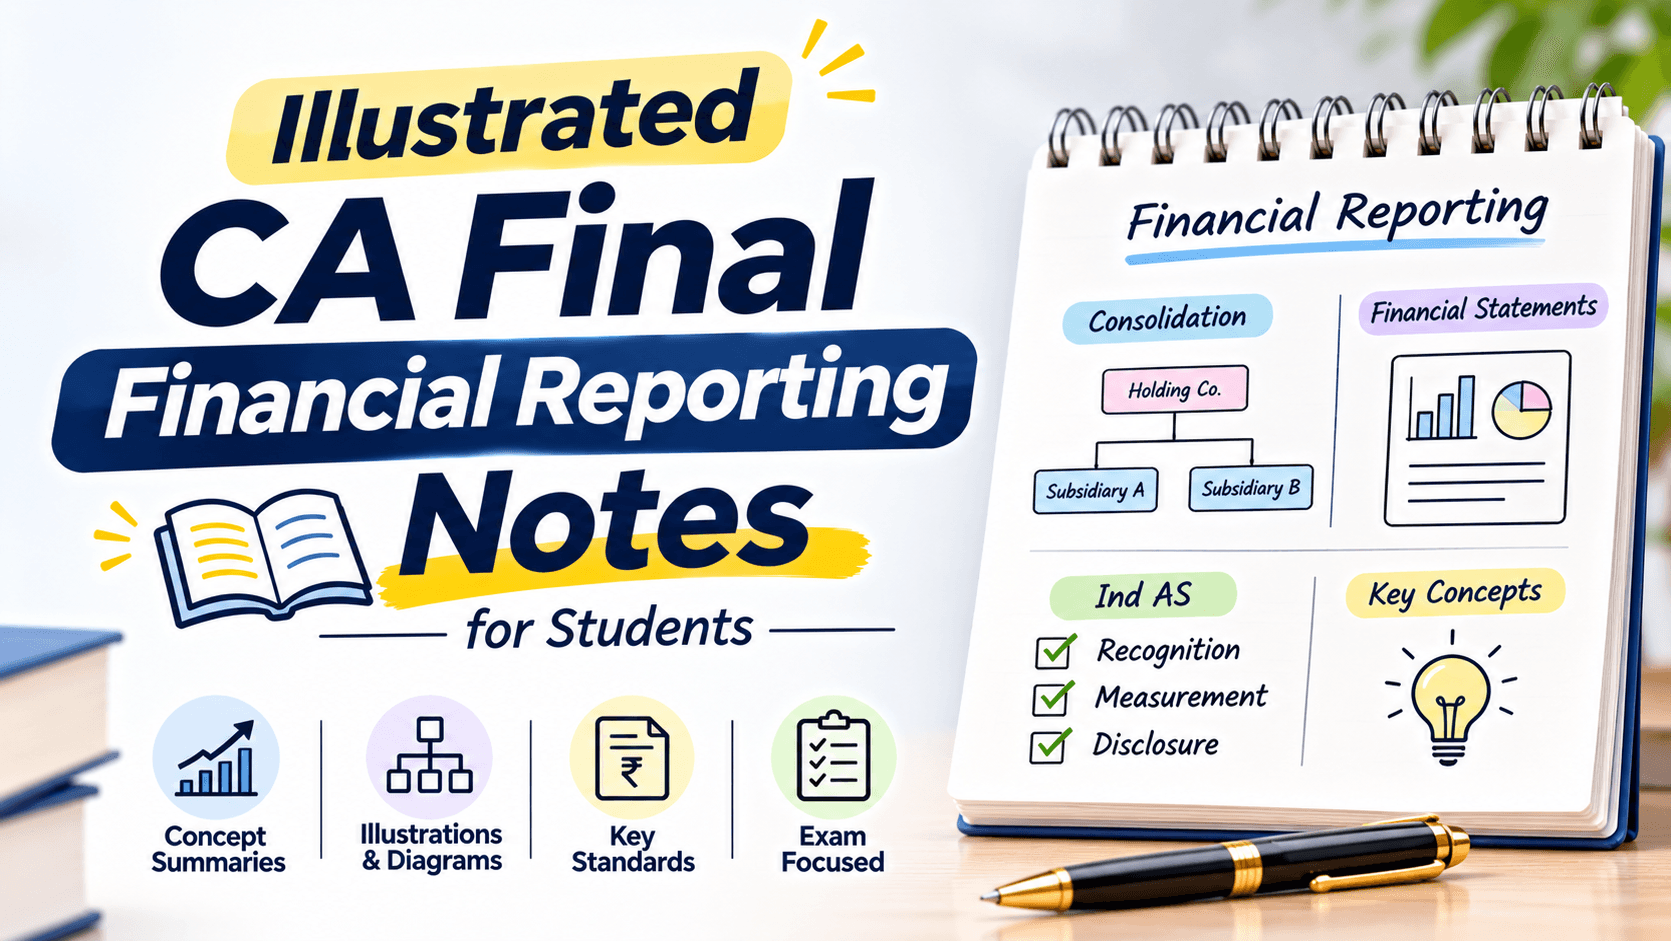
Illustrated CA Final Financial Reporting Notes for Students
Organise CA Final Financial Reporting revision with visual frameworks, comparison tables, worked examples and question practice. Use Studycaller to make review more…
In this article(9 sections)ShowHide
CA Final Financial Reporting includes concepts that can be difficult to connect when notes are written as long blocks of text. Illustrations, decision trees, comparison tables and step-by-step workings can make relationships easier to see and revise. The visual format is most useful when it clarifies a method or distinction.
These notes are a framework for organising your own study material, not a substitute for the prescribed standards, examples or amendments. Check the current syllabus and official materials for your examination attempt before using any topic summary in practice.
Choose the Right Visual for the Concept
Use a flowchart when a topic requires a sequence of decisions, a comparison table when two treatments need to be distinguished, and a worked example when calculations follow a set process. A visual should answer a specific learning need rather than simply make the page attractive.
Keep the labels accurate and the sequence logical. If the topic contains an exception or an alternative treatment, show it clearly instead of hiding it in small text. When a visual becomes too complex, divide it into smaller connected diagrams.
Build a Concept Map Before Details
Start with the main principle, then add the conditions, measurement or recognition steps, presentation requirements and related disclosures as applicable to the topic. This map gives you an overview before you study the detailed rules.
Use your prescribed material to confirm each branch of the map. Avoid relying on an illustration copied from an old source because requirements and syllabus coverage may change. Add a note to any area that needs amendment verification before the exam.
Turn Similar Standards Into Comparison Tables
When two standards or accounting treatments are easy to confuse, compare their scope, recognition criteria, measurement basis, presentation and key exceptions. The exact comparison fields depend on the topic. A clear table makes the difference visible and gives you a checklist for solving questions.
After preparing the table, test it with a short question. Ask which facts matter and how the answer would change if one fact were different. This helps you use the comparison in application rather than memorising rows without understanding their significance.
Illustrate Calculation-Based Topics Step by Step
For calculation-heavy areas, use a worked example that separates the information given, assumptions or relevant facts, calculation stages and final presentation. Label each step so you can explain where a figure comes from. Keep detailed explanations in the main notes if the visual becomes too dense.
Once you understand the example, solve it again without looking. Then change one input or condition and work through the effect. Small variations help you check whether you understand the method or have simply memorised a particular answer.
| Visual element | Best use | Check before finalising |
|---|---|---|
| Concept map | Show how ideas connect | Are all key relationships accurate? |
| Decision tree | Show a sequence of choices | Are conditions and exceptions clear? |
| Comparison table | Separate similar treatments | Can I explain the differences? |
| Worked example | Show calculations in order | Can I reproduce the steps independently? |
| Error cue | Highlight a recurring mistake | Does it prevent a real, known error? |
Use Visual Notes for Revision, Not First Exposure Alone
Visual notes are often easier to scan than lengthy chapters, but they may omit the reasoning that makes a standard understandable. Study the complete prescribed explanation first, then use the visual to organise and retrieve the key points.
If you find yourself unable to explain a branch or calculation, return to the source material and fill the gap. Do not add more arrows or colours to solve a conceptual problem. Improve the understanding first, then update the visual if needed.
Example of a Visual Note Layout
The following table shows a reusable structure for converting a Financial Reporting topic into a compact revision page. Fill it with accurate topic-specific details from the current prescribed material rather than treating the example as a summary of a particular standard.
Practise Questions Alongside Each Illustration
Attach one or two representative questions to every major visual. Attempt them without looking at the diagram, then use the diagram to review the logic. This reveals whether the visual supports independent problem-solving or only feels familiar when it is open in front of you.
Use mock tests and question banks to expose unfamiliar combinations of concepts. If you lose marks, identify which branch, condition or calculation step you missed. Update the relevant visual with a short prompt, but keep the full solution in your practice records.
Keep Visual Notes Accurate and Easy to Update
Add a chapter title, source reference and last-checked date to important charts. If a change in prescribed material affects the topic, update the visual and remove superseded wording. Keep older versions separate so they are not accidentally used for final revision.
Use a consistent visual language across your notes: the same style for conditions, exceptions, calculations and warnings. Consistency reduces the effort required to interpret a page and makes it easier to compare related topics during revision.
Use Studycaller to Close the Practice Loop
Studycaller can be used as part of a structured revision routine when you pair visual summaries with exam-style practice and error review. Choose the next topic based on your performance and reattempt questions that test the concepts you found difficult.
Your goal is not to produce the most elaborate diagrams. It is to recall the correct principle, apply it to the facts and present a clear answer under exam conditions. Keep the visuals simple enough to revise quickly and detailed enough to preserve essential distinctions.
CA Final notes students love
Free notes from the Studycaller library, picked for this article.
 Summary
CA Final · Others
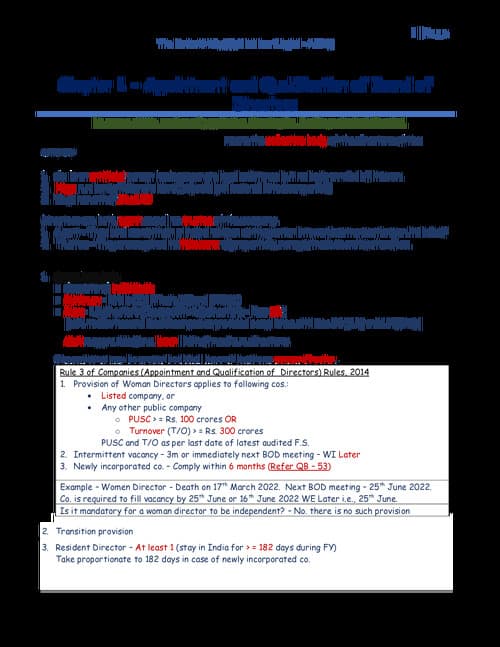
Company Law Summary Notes Set A - Appointment and Qualification of Directors
Nikita AgrawalLikes 40Views 32.5k Detailed Notes
CA Final · Integrated Business Solutions
Shubham Singhal Law Book SPOM
RahulLikes 32Views 19.6k Summary
CA Final · Others
SPOM Set A Notes: SEBI Act, FEMA, FCRA, IBC and Companies Act Summary Notes
A LalLikes 16Views 17.2k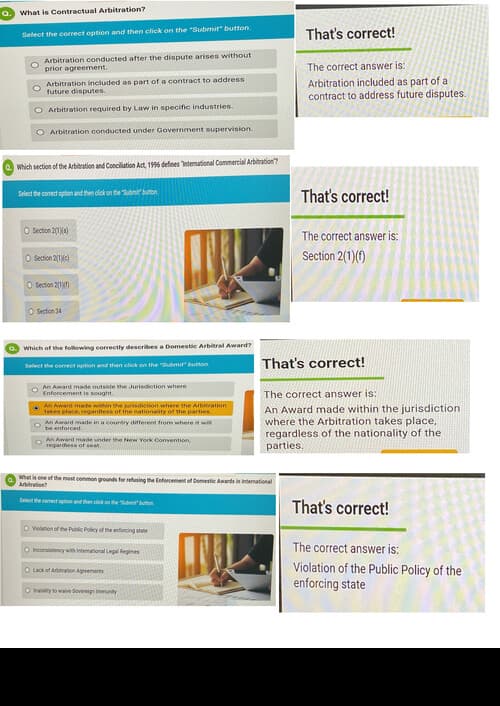 MCQs
CA Final · Others
MCQ for set c (Arbitration and conciliation act)
Nikita AgrawalLikes 12Views 24k
Frequently asked questions
What are illustrated CA Final Financial Reporting notes?
They use concept maps, flowcharts, comparison tables and worked examples to organise Financial Reporting topics. Their purpose is to make relationships and solution steps easier to understand and revise.
Are visual notes better than written notes?
They are useful for topics involving relationships, choices or calculation steps, but they do not replace detailed explanations. Combine visuals with prescribed material and independent question practice.
Which visual formats work best for Financial Reporting?
Concept maps show relationships, decision trees show sequences, comparison tables distinguish similar treatments, and worked examples explain calculations. Choose the format that clarifies the particular concept.
Should I make illustrations before studying a chapter?
First build a basic understanding from the prescribed material. Then create a visual that summarises the important relationships. If a chart is made before understanding, it may simplify the topic incorrectly.
How can I use diagrams for revision?
Review the diagram, cover it and reproduce its structure from memory. Then solve a related question without looking at the visual and check whether you can apply the concept correctly.
How do I keep Financial Reporting notes updated?
Record the source and last-checked date, verify applicable amendments and syllabus requirements, and revise any affected charts. Keep outdated versions separate from your active revision material.
Should each topic have a separate visual note?
Use one page for a small, connected concept and several linked pages for a complex topic. Readability and accuracy matter more than fitting everything into a single page.
Can visuals help with calculation-based questions?
Yes, when they show the order of calculations, the source of figures and the final presentation. You still need to practise the calculations independently and understand the underlying accounting treatment.
Can Studycaller help with CA Final FR preparation?
Studycaller can be part of a structured revision process when paired with relevant practice questions and careful error analysis. Use materials aligned with your current prescribed syllabus.
What is a common mistake when creating visual notes?
Making a diagram attractive but incomplete is a common mistake. Keep important conditions, exceptions and steps visible, verify the content and test the visual against a representative question.