PDF · Handwritten Notes
SM Chart by Swapnil Patni Sir: CA Inter Strategic Choices on One Page
- Shared by
- Niteesh Singh Patel
- Course
- CA Inter
- Subject
- Other Stuff
- Added
- 19 Jun 2024
Part of: CA Inter
Continue reading in the Studycaller app
The full PDF — free to read, save and share in the app.
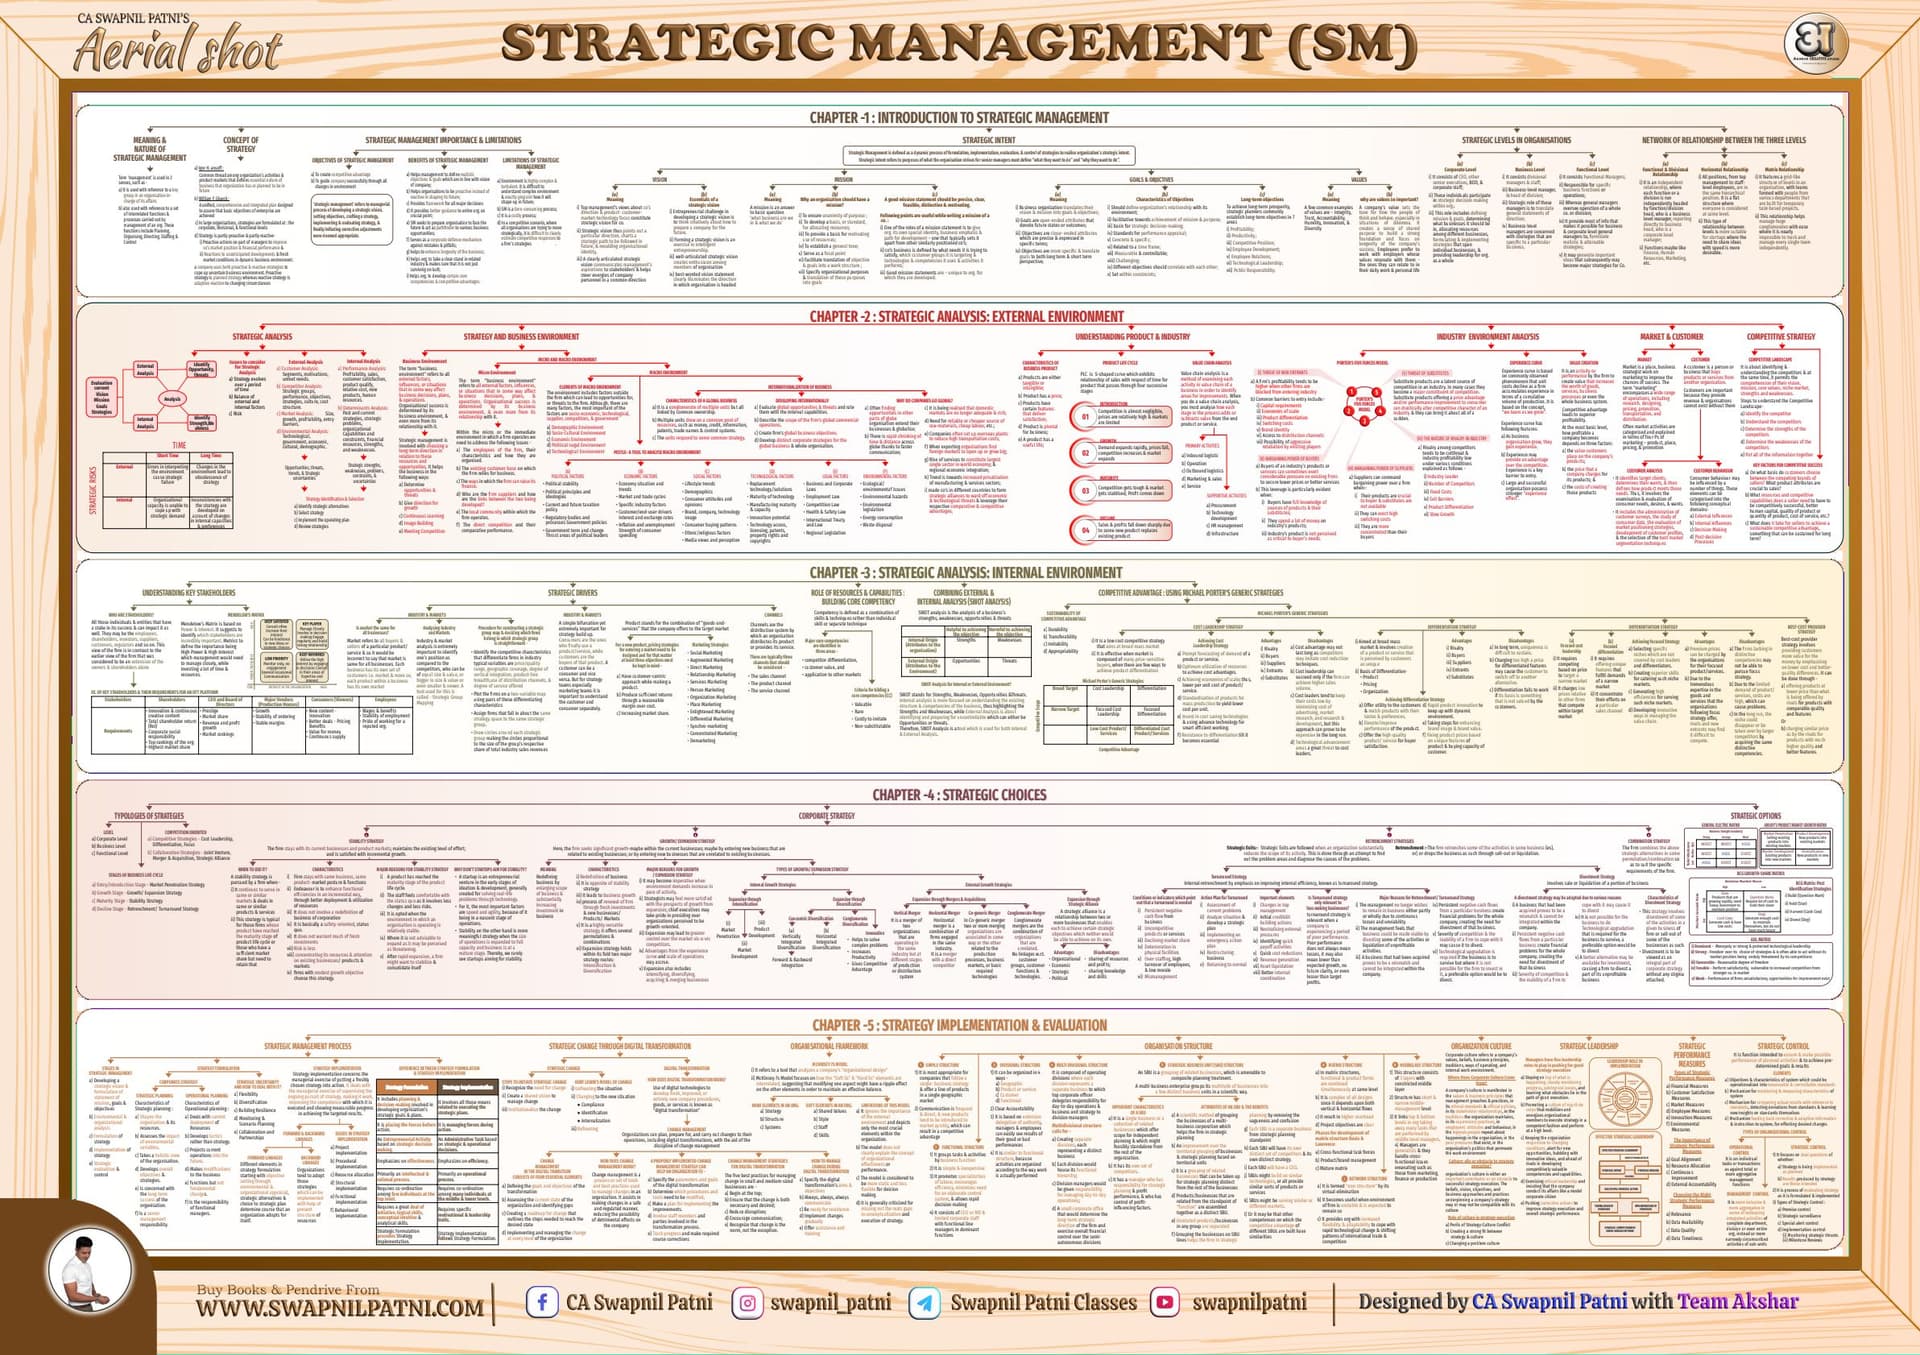
This SM chart by Swapnil Patni Sir puts the strategic choices topic of CA Inter Strategic Management onto a single revision sheet. It starts with the three levels of strategy: corporate, business and functional. It then sets out the four corporate strategies side by side: stability, growth or expansion, retrenchment and combination. For each one the chart gives the meaning, characteristics and main reasons for adopting it. It also covers growth routes such as intensification, diversification, mergers and strategic alliances. Under retrenchment it covers turnaround and divestment. The chart closes with the BCG and GE matrix strategies and the five competitive positions. It suits CA Inter students who want a quick visual summary of this chapter before the exam. It is also useful for students searching for an SM chart they can revise in a few minutes.
What the SM Chart Covers in Detail
The chart opens with the levels of strategy (corporate, business and functional) and the stages of the business life cycle. It then sets out four columns. Stability strategy lists nine characteristics, such as the same product-market posture, incremental efficiency gains, low risk and little fresh investment. It also notes that stability suits firms at the maturity stage. Growth or expansion strategy is described as redefining the business. It is split into internal and external growth: intensification, concentric and conglomerate diversification, innovation, and mergers. The merger types shown are horizontal, vertical, co-generic and conglomerate, with their advantages and disadvantages. A strategic alliance is defined as a relationship that helps each firm reach objectives it could not reach alone. Retrenchment is divided into turnaround and divestment. Combination strategy is defined as a mix of these alternatives chosen to suit the firm's needs. The chart also asks why startups don't aim for stability.
Key Points to Remember for the Exam
Several lists on the chart appear often in descriptive answers, so learn them in order. The first is the six indicators that a turnaround is needed: persistent negative cash flow, uncompetitive products, declining market share, deteriorating physical facilities, over-staffing with low morale, and mismanagement. Next are the five steps of the turnaround action plan, from assessing current problems to returning to normal. Then come the eight elements of turnaround, such as changes in top management, credibility-building actions, quick cost reductions and asset liquidation. The chart also lists five reasons for divestment, including an acquired business that proves a mismatch, inability to cope with competition, and lack of required technological upgradation. Remember the BCG post-identification strategies: build for question marks, hold for stars, harvest for cash cows and divest for dogs. Finally, note the GE matrix grid of invest, hold and divest, and the five competitive positions: dominant, strong, favourable, tenable and weak.
How to Revise with This SM Chart
Use the chart after you have read the strategic choices chapter in the ICAI study material, not in place of it. The chart gives headings and short points. The study material gives the full explanations and examples that case-based questions draw on. A good method is to cover one column at a time and recall its characteristics or reasons aloud, then check against the sheet. Before attempting RTPs and MTPs, glance at the chart to refresh the turnaround elements, divestment reasons and merger types. These lists are often asked in theory and case-study questions. When you go through past papers, mark which boxes on the chart each question touched, so you can see which areas need more attention. Because everything fits on one page, the chart works well for the last day before the exam and for quick revision between other chapters.
Who Should Use the CA Inter SM Chart
The chart is meant for CA Inter students preparing Strategic Management, especially the chapter on strategic choices and corporate-level strategies. It helps students who find the chapter long and list-heavy and want everything placed side by side for comparison. Students who follow Swapnil Patni Sir's SM teaching will recognise the chart's layout and headings. Other students can use it as a compact summary alongside their own notes. It is most useful in the final weeks before an attempt, when there is no time to reread the whole chapter. It also helps when you want to check that you remember every point in a list such as turnaround indicators or BCG strategies. The note is a single page, so treat it as a revision aid rather than full chapter notes. Pair it with the study material and practice questions for complete preparation.
Key topics in these notes
- Levels of strategy: corporate business functional
- Stability strategy characteristics and reasons
- Growth/expansion strategy: intensification and diversification
- Concentric and conglomerate diversification
- Horizontal vertical co-generic and conglomerate mergers
- Strategic alliance
- Turnaround strategy indicators action plan and elements
- Divestment strategy reasons and characteristics
- Combination strategy
- BCG matrix post-identification strategies
- GE matrix invest hold divest grid
- Competitive positions: dominant to weak
Explore more Corporate and Other Laws notes
- sm chart
- strategic management
- ca inter
- swapnil patni sir
- strategic choices
- bcg matrix
- turnaround strategy
- revision chart
Related notes
- 90 Days Planner For Sep 26 Taxation If Anybody wants PW , Vishwas CA and Ca Parveen Sharma Sir Classes Available DM me to get ✅
- CA Test Series , Scan To Get ✅ If Anybody wants PW, Vishwas CA and Parag Sir classes DM me
- Ch 4 Law STar sheets By CJ Sir May 27 Batch If Anybody wants PW, Vishwas CA and Parag Sir classes DM me
- Ch 3 Law STar sheets By CJ Sir May 27 Batch If Anybody wants PW, Vishwas CA and Parag Sir classes DM me
- Ch 2 Law STar sheets By CJ Sir May 27 Batch If Anybody wants PW, Vishwas CA and Parag Sir classes DM me
- Ch 1 Law STar sheets By CJ Sir May 27 Batch If Anybody wants PW, Vishwas CA and Parag Sir classes DM me
- Sep 2026 Law Question paper If Anybody wants PW, Vishwas CA and Parag Sir classes DM me ✅
- May 26 Air 1 LAW ICAI Certified Copy If Anybody wants PW, Vishwas CA and Parag Sir classes DM me ✅
What to study next
Frequently asked questions
What is the SM chart by Swapnil Patni Sir?
It is a one-page Strategic Management chart for CA Inter. It summarises strategic choices, including stability, growth, retrenchment and combination strategies, along with the BCG and GE matrix strategies.
Is this the full CA Inter SM chart book PDF?
No. This upload is a single page that covers the strategic choices topic. It is not a complete book of all chapters.
Which topics does this SM chart cover?
It covers the levels of strategy, stability and expansion strategies, diversification, the types of mergers, strategic alliance, turnaround and divestment strategies, the BCG matrix, the GE matrix and competitive positions.
What are the indicators that a turnaround is needed according to the chart?
The chart lists persistent negative cash flow, uncompetitive products or services, declining market share, deterioration in physical facilities, over-staffing with high turnover and low morale, and mismanagement.
What are the BCG matrix post-identification strategies?
The chart lists build for question marks, hold for stars, harvest for cash cows and divest for dogs.
Can I use the SM chart instead of the ICAI study material?
It works best as a revision aid. Read the chapter in the study material first, then use the chart for quick recall and last-day revision.
How can I get the full SM chart PDF?
Open it free in the Studycaller app.