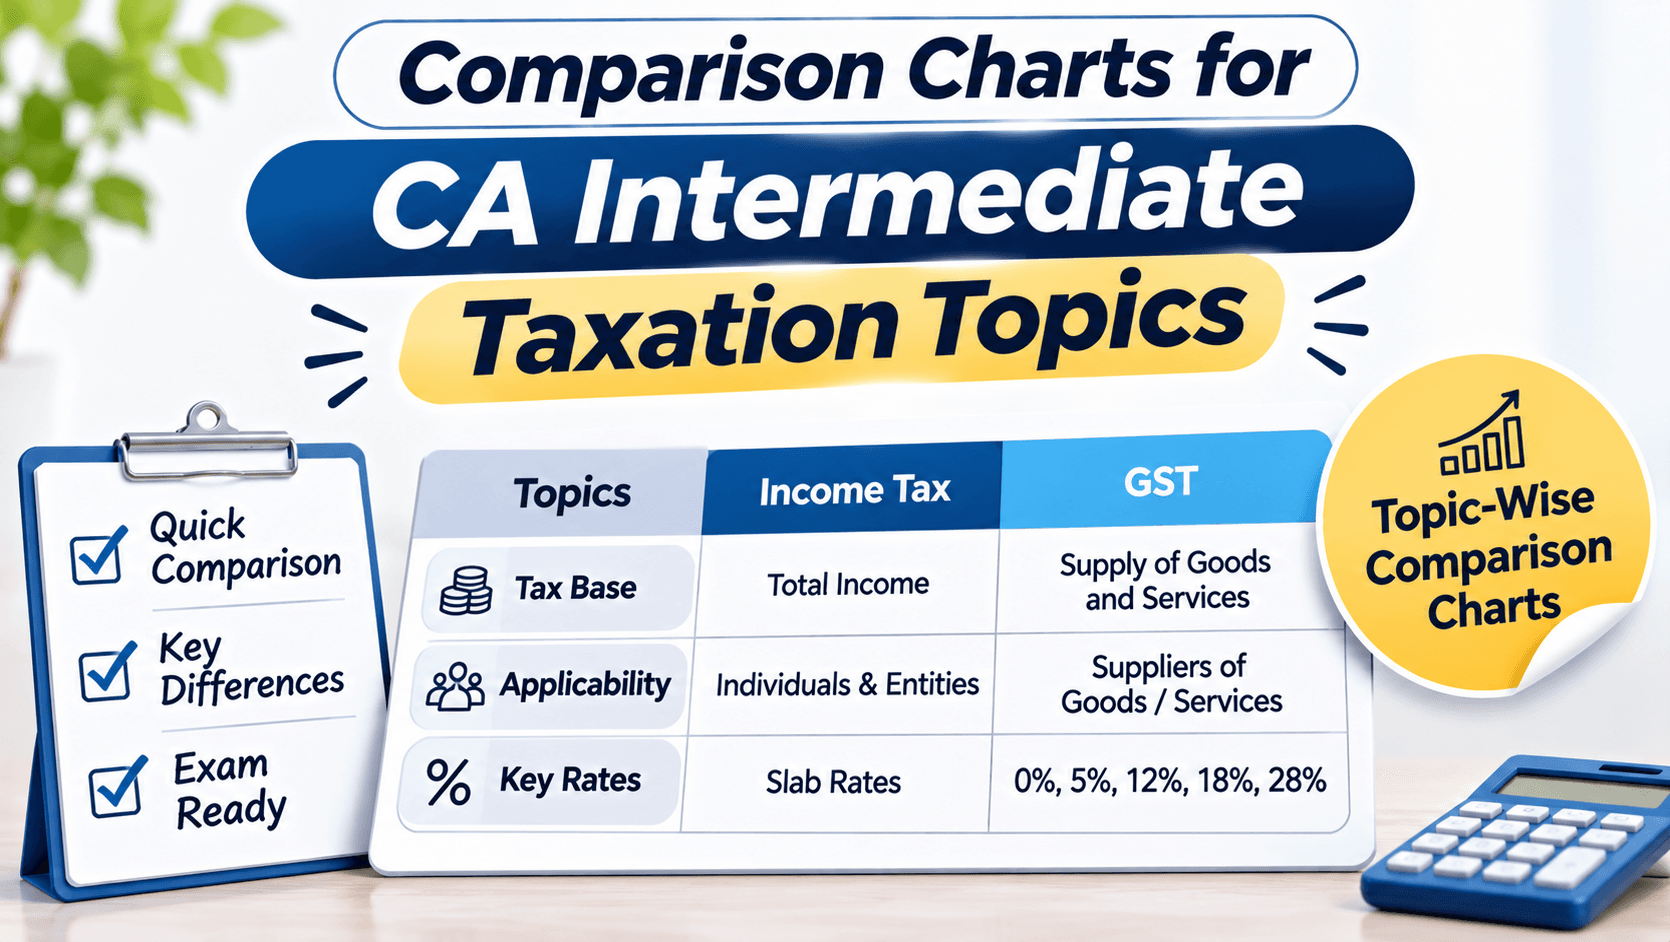
Comparison Charts for CA Intermediate Taxation Topics
Understand how to create useful comparison charts for CA Intermediate Taxation, organise similar provisions, revise key differences and practise application-based…
In this article(9 sections)ShowHide
Effective CA preparation requires more than completing chapters. Students need to understand concepts, revise them regularly and apply them accurately in examination questions. Well-organised study material can make this process easier, particularly when the syllabus is extensive.
This guide explains practical ways to organise and use revision resources while staying aligned with current applicable ICAI material. Studycaller can be part of a wider learning routine alongside independent practice and regular self-assessment.
Why comparison charts help in Taxation
CA Intermediate Taxation requires students to understand rules, conditions, exceptions and practical consequences. Similar provisions can be easy to confuse. A comparison chart places related concepts side by side so that differences become easier to identify during revision.
Identify topics suitable for comparison
Start by marking concepts that are commonly confused: definitions, alternative treatments, conditions, exceptions, time limits, classifications or procedures. Make a chart only when a genuine comparison exists. Use your own practice errors to decide which distinctions deserve a chart.
Choose consistent comparison headings
Choose headings that matter for the topic. These may include meaning, applicability, conditions, exclusions, time limit, documentation, calculation method and practical effect. Use the same headings for each concept so that differences are easy to scan.
Keep Income Tax comparisons accurate
For Income Tax, charts can organise distinctions between classifications, deductions, exemptions and computation treatments within the applicable syllabus. Record conditions and exceptions, not just the headline rule. Verify numerical limits and amendments against current study material before adding them.
Use charts for GST concepts and procedures
GST topics may involve definitions, supply, registration, time and place rules, input tax credit conditions, documentation and compliance processes. A comparison chart can show distinctions, while a flow-style table may be better for procedural sequences. Keep exceptions visible and check current material.
Add examples to explain differences
A short fact pattern can show how a distinction works. State which treatment applies and why, then change one fact and ask whether the result changes. This tests understanding of the condition behind the difference rather than memory of the chart layout.
Revise charts through question-based recall
Cover one side of a chart and recall the missing information. Alternatively, read a fact pattern and decide which concept applies before checking your notes. Revisit difficult charts at planned intervals and practise questions based on conditions you repeatedly forget.
Keep charts current and manageable
Update charts when relevant syllabus or official changes apply. Remove outdated information and record the applicable period where needed. Avoid creating a chart for every paragraph; a small set of accurate, high-value comparisons is easier to revise than crowded pages.
Quick Reference Table
| Chart feature | What to record | Why it matters |
|---|---|---|
| Main rule | Meaning and basic treatment | Establishes the concept |
| Conditions | Requirements for applicability | Prevents incorrect selection |
| Exceptions | Situations treated differently | Avoids incomplete answers |
| Practical effect | Impact on computation or compliance | Connects rule with application |
CA Inter GST notes
Free notes from the Studycaller library, picked for this article.
 Questions
CA Inter · Taxation
CA inter GST super 30 question by CA Vishal bhattad sir
HarshLikes 43Views 49.6k Amendments
CA Inter · Taxation
CA Inter Indirect Tax Question Bank by CA Amit Mahajan for May June Sept Dec
InterverseLikes 36Views 30.5k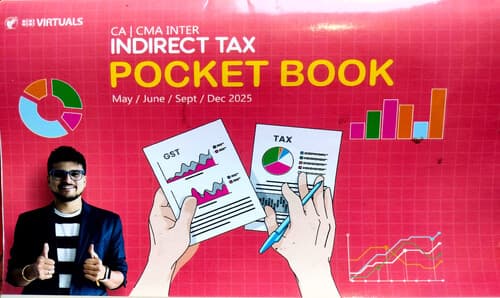 Summary
CA Inter · Taxation
CA/CMA Inter Indirect Tax Pocket Book May/June/Sept/Dec 2025
AbhinavLikes 26Views 20.9k Questions
CA Inter · Taxation
Gst QB
VickyLikes 24Views 26k
Frequently asked questions
Are comparison charts useful for CA Intermediate Taxation?
Yes. They help distinguish similar provisions and treatments during revision. Verify every detail against current ICAI material.
Should I make separate charts for Income Tax and GST?
Organise charts by subject and chapter so that rules remain easy to locate and differences are not mixed.
What should a Taxation comparison chart include?
Include the main rule, applicability, conditions, exceptions and practical effect. Verify time limits and numerical details.
Can comparison charts replace detailed Taxation notes?
No. Study the chapter in detail first, then use charts to revise key differences and practise questions.
How can I remember similar Taxation provisions?
Compare provisions side by side, test yourself with short fact patterns and practise applying each condition.
Should I use colours in Taxation charts?
A limited and consistent colour system can highlight rules and exceptions. Prioritise readability and accurate wording.
How often should I update my Taxation charts?
Review them when relevant amendments or syllabus updates apply, and verify details through official sources.
How do charts help in practical questions?
They help identify which condition or treatment applies to the facts. Follow revision with questions using changed facts.
When should I prepare comparison charts?
Prepare them after studying related topics and identifying genuine points of confusion, then update them through practice.
How can Studycaller support CA Inter Taxation revision?
Studycaller can support organised revision. Combine resources with current ICAI material, personal charts and question practice.Studycaller can support a structured preparation routine when used alongside current official study material, regular revision and independent question practice.